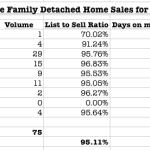
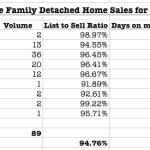
February 3, 2012

Simi Valley October 2011 Home Sales

Simi valley Real Estate homes for saleOctober Single Family Detached Home Sales for Simi Valley did not react much different that September.  Volume is up over 2010 and 2009.  Homes under $400k are pulling the lion’s share of the activity and as interest rates drop into low 4′s and high 3′s buyers still remain cautious.

I mentioned last month the sluggish upper end of the market.  If you have a home in the $900k to $999,999 price range, did you know that only 4, yes that is right FOUR homes have sold since January 1, 2011 in  this price range for Simi Valley real estate?   Currently there are 6 homes on the market in this price range and the last sale for the price range was in May.  So, if you are listed in this range and wonder what is happening, wonder no more, even with attractive interest rates buyers for this range are not abundant at this time.  At the same time, 10 Simi Valley homes have sold over 1 million with one of those being a custom spec house.

The ditressed market still is a major influencer on the overall market.  RealtyTrac recently reported:

California default notices increased 17 percent from the previous month to a 13-month high, helping the state post the nation’s second highest foreclosure rate: one in every 243 housing units with a foreclosure filing in October. A total of 29,240 default notices were reported in California in October, a 1 percent increase from October 2010 — the first year-over-year increase in defaults in California since November 2009.

Even though other parts of the country are seeing some relief.  However; Nevada, California, Florida and Arizona continue to battle through many struggling home owner’s loans with modification attempts, short sales and foreclosure.

simi valley homes sales october 2011


simi valley homes sales october 2011 by volume


Below is the 30 year interest rate chart for 30 year conforming loans.  2011 has continues to average with the lowest rates.  It is no wonder that investors are out snapping up deals with money this cheap.  The Blue line below should be a wake up call to those sitting on the sidelines.  The distressed market is continuing to to keep prices in check.

30 year interest rates monthly  average

Simi Valley September 2011 Home Sales Volume at 2008 Levels

distressed house simi valleyDo Simi Valley September Homes Sales show another false positive for the real estate market?  In 2009 and 2010 September sales volume for single family detached homes tailed off after a 2008 rebound over a record low in 2007.  Fast forward to today and low interest rates are enticing investors and home buyers to enter the market, however pricing is still flat.  The market for homes below $400,00 is still leading the way with 53% of the sales for the month. 57% of those sales are dominated by Short Sales and Bank Owned homes.  25% of all the Simi Valley SFD homes sold were snapped up by all cash buyers and 40% with conventional financing.  This high percentage of Cash and Conventional buyers shows that low interest rates combined with attractive pricing is bringing savvy real estate buyers to the table.

Pricing is in a low trough at this point and has remained in this trend for most of 2011.  The mid to high $200k price point has solidified a low for Simi Valley Single Family Detached Housing and only dips below this range if the properties have significant damage.  A recent article from CoreLogic® (NYSE: CLGX) stated:

“Even with low interest rates, demand for houses remains muted. Home sales are down in September and the inventory of homes for sale remains elevated. Home prices are adjusting to correct for the supply-demand imbalance and we expect declines to continue through the winter. Distressed sales remain a significant share of homes that do sell and are driving home prices overall,” said Mark Fleming, chief economist for CoreLogic.

What does this mean for housing above the $500k price point?  Those homes have trended selling at 8%-10% below the original list price showing the the market absorption rate for these houses is still dictated by buyer mood.  The homes between $400k to $500k experience on average only a 3%-4% drop in price from List to Sell.

We can take away the following five points

  1. Low interest rates are bringing buyers out.
  2. Buyers refuse to bid up pricing and remain patient.
  3. Homes in well maintained condition are seeing short market times when price matches buyer sentiment.
  4. Investors are out accumulating rental property.
  5. Distressed property still make up over 50% of the inventory.

simi valley real estate sales september 2011 chart


simi valley real estate sales september 2011


Simi Valley August 2011 Home Sales Volume Slows Average Sales Price Rebounds

Simi Valley House for saleSimi Valley Homes Sales in August 2011 for single family detached units slowed.  The pullback is not alarming and was something I anticipated after such a strong showing in July for the following reasons:

  • People like to move before school starts (contributing to July increased sales).
  • Prices have continued to decline making many Simi Valley homes for sale attractive-good-buys.
  • Interest Rates continue at historic low rates.  (Money is cheap)
  • National Economic News in August and big drops in the Stock Market rocked consumer confidence.
  • The Political Atmosphere in Washington DC (created by all parties) is killing consumer confidence.

The average sales price showed some rebound, but I want to recap what the average sales price and the median sales price really tells us.

If you look at the charts I post each month, I break down the sales in price brackets by $100,000 ranges.  You can see each month that the bulk of all Simi Valley single family detached homes are selling under $500,000.  Some months no houses sell in the upper end of the market and when this happens the average sales price can swing pretty dramatically.  In the recent months that swing was influenced by a larger number of homes selling under $300,000.  This trend started in January 2011 and continued on through August.

The Average Price method of looking at the market can give a good idea of how the upper end of the housing market is moving.  dramatic decreases in average sales price indicates the upper end units are not selling.  While the the Median price reveals more of how the average all market is reacting in general.

The last three years has revealed that the low end is selling, what is interesting to watch is how the upper end of the Market (above $500,000) is selling. When Prices are aggressive and interest rates are low investors and landlords come in on the lower end properties as we have been seeing this year in Simi Valley.  The general public typically lags behind the investor activity.  A healthy market in the upper price ranges can indicate better employment opportunities (an improving economy).  It can signal that employers may look to Simi Valley as a place to locate and it can bolster the local economy with a higher demographic of shoppers, all of which can influence property prices upward.

The summary is that the upper markets are still struggling, and the over all perception of good buys is fully being realized by investors and those with conventional financing looking to lock in low interest rate for the long haul.

Past Market Reports:

Thanks for reading Simi Valley’s Premiere Real Estate Blog!

Author – Ted Mackel Simi Valley Real Estate Agent – Keller Williams Realty

Ted Mackel is a top producer at Keller Williams Realty Simi Valley,

specializing in Simi Valley Real Estate

(805) 432-7705

Simi Valley July 2011 Home Sales Surge on Volume Average Sale Price drops $57k

simi valley homes sold market updates for simi valley home sellers and buyersSee Simi Valley Homes For Sale under $300,000

The Simi Valley Real Estate Market is in the middle of a very interesting transition and while the traditional media and my industry tend to create reports that either cheer-lead or sell subscriptions; it would be prudent to really look at what has happened in July and a trend that started back in December of last year.

Sales of Simi Valley Single Family detached housing under $300,000 has been growing in volume.  Now, more than any other time since the bottom fell out of the real estate market in 2007, we are seeing prices drop and affordability rise with continued low interest rates.   In the Spring of 2009 we saw similar pricing, but investors rushed in and pushed pricing in this segment back up to the low $300,000 range.

What becomes even more interesting this time around is that of the 19 Simi Valley homes that sold under $300,000 in July 2011, 60% were purchased with conventional financing or cash with an average price of $278,000. Cash and conventional purchasers can be attributed to increased activity by investors looking for rental properties and properties in poor condition that could be restored and flipped.

What is causing Volumes to Surge? 

1. Prices/affordability 2. Low interest rates.

What is not happening on surging volumes?

Prices are not being run up.  Looking at Simi Valley Home Sales for July 2011 we can see that 84% of all sales were under $500,000 and that the top end over $900,000 had no sales for the month.  Sluggish sales over $500,000 contributes to the lower average sale price.

Tracking the average sale price does not necessarily mean that Simi Valley Home Owners have lost $57,000 in value, what it does indicate, is when you compare the average sale price each month over the course of time you can spot trends over the whole spectrum of price ranges, any major shifts between months as we are seeing between June (Simi Valley June Market Report) and July, helps us to look close at what is selling, who is buying and what are the conditions that are driving these sales.

Real Estate Markets are local,  traditional media tends to report regional and statewide Real Estate trends, which you can see don’t amount to much when we look at the activity for Simi Valley.

The local, State and Federal economic issues, $4.00 a gallon gasoline, employment opportunities have a huge influence on home buyers.  Additionally, the Foreclosure market, Short Sale Market and Loan Modification Market are still in the middle of their mountain of problems.

What is becoming clear from my experience with buyers in my car and looking at the trending data; buyers are very interested when pricing and condition are right, but they are unwilling to jack up the pricing (above market value) in bidding wars.

While this all may sound horrific to home sellers, this is all part or a greater stability that is forming.  Increasing volumes on lower prices is positive, what we don’t want to see is decreasing volumes and lower prices.

Simi Valley homes Sales for July 2011

Simi Valley homes Sales for July 2011 Graph

Simi Valley June 2011 Real Estate Market Report

simi valley homes for sale june 2011 chartThe Simi Valley June 2011 Real Estate Market Report is showing some improvement for June single family detached homes (SFD) sold.  Average home price for Simi Valley rose approximately $30,000.00 on increased volume.  While the rise in average sale price may be encouraging, it is premature to present this as any sign of recovery.  The number of SFD Simi Valley homes selling under $300,000 remained higher than past trends and the bulk of the properties selling in the Simi Valley still dominate the $300,000 to $400,000 range. An interesting statistic to note is that conventional and cash buyers are out numbering the FHA/VA buyers.  The increase volumes below $300,000 for Simi Valley SFD homes still shows softness in the overall real estate market.  Buyers are taking advantage of lower prices and low interest rates which is driving slightly higher sales volumes.

Nationally, MacroMarkets, LLC recent (June 2011) survey of industry economists and real estate experts showed that most believe that housing prices will hit their bottom this year and may have in the 1st quarter, leading to stability of pricing through 2015.

Shiller added, “If it were to materialize, such a scenario might be better described as a forecast of price stability rather than a rebound.  A 2% a year home price increase will not inspire a lot of consumer confidence.

simi valley homes for sale june 2011 table

simi valley homes for sale june 2011 chart

Simi Valley May 2011 Real Estate Market Report

Real Estate Spiral Down?

The Simi Valley May 2011 real estate market report for home sales is continuing on some similar trends. Total single-family detached homes sold in the month of May were slightly lower than the previous year with a 6 1/2% decrease, but higher than in April 2011. The average sales price for Simi Valley single-family detached homes declined for a second month in row from $443,038 to 433,502. The decline is influenced by the higher number of homes that close in the under $400,000 price range.  If you look at each chart from the monthly reports posted in the Market Updates section of this blog; it is clear the highest buyer activity is in the below $400,000 price range. Continuing from earlier this year we have seen more homes selling below $300,000 and in May there were 16 single-family detached homes closing below this level which is the highest number since the height of the real estate market back in 2006-2007.

In recent reports Robert Shiller, one of the economists behind the S&P Case/Shiller index of home prices, has stated he would not be surprised if home values decline another 10% to 25%. While this seems alarming, Mr. Schiller is clear that some of this decline will not be seen in actual prices but rather masked by inflation.

May of 2009 saw homes close at lower pricing than today and each time the Simi Valley real estate market approaches price points similar to 2009, buyers and investors purchase activities pick up and appear to help support a flatter market condition.

With home sales under 300,000 increasing, first-time home buyer’s affordability increases as well. Some housing tracts in Simi Valley stabilized and some pulled back a little. Overall, the three-year trend of approximately 80 single-family detached homes selling each month continues and signals for gains and recovery in home pricing is still on hold. The chart below is broken into pricing categories, if you look at the price range your home falls into, you can see what the average market timing is, what the average sales price is compared to the original list price and how many homes in your range or closing each month.

 Simi Valley May 2011 home sales report

 Simi Valley May 2011 home sales graph

Simi Valley Home Sales Report April 2011

Simi Valley Single-family detached home sales for the month of April 2011 did not continue to increase in the number of properties sold as we saw in February and March. What was more interesting, was that the volume dropped a little over 10% from 2010. The month-to-month uncertainty that still clouds the market, is a big reason why I do not make claims recovery. Simi Valley is still experiencing single-family detached homes selling under $300,000, the bulk of sales activity continues to be under $500,000 and distressed properties will continue to be a big part of the Simi Valley real estate market for some time to come. Gasoline prices in April near $4.50 a gallon and general economic concerns, locally, statewide and nationally are not improving.

The importance to homeowners at this time is understanding that any market recovery is going to be slow, plans to sell property in the future should consider how the market is reacting in these difficult economic times. The winners in the current marketplace are the buyers with historically low interest rates and pricing  hitting pre-bubble levels as reported in the Wall Street Journal in February.

simi valley home sales april 2011

simi valley home sales april 2011

Simi Valley Homes Sales Report for March 2011

Simi Valley home sales saw the second straight month with the highest volumes since 2006. However, mimicking February, we are still seeing more listings and more sales below $300,000 and the final sales ratios averaging more than 5% below the original list price. Good thing,  but home sellers and homeowners I speak with are more interested as to when it will see a recovery in pricing.

simi valley home sales march 2011 chartsimi valley home sales march 2011 graph

Simi Valley Homes Sales Report for February 2011

Simi Valley single-family detached home sales for February 2011 saw the highest volumes since 2006. While the typical response to a record month of sales was jubilation and claims of market recovery, looking closer at the numbers shows that while there was an uptick in the number of homes sold the market still has a ways to go before we can declare recovery. The continuing trend to watch is the increase of homes sold under $300,000.  Most of 2010 saw a few sales under $300,000 per month, but as of December 2000 and the number is picked up. Even with record low interest rates last fall, buyers may have come out to purchase more homes, but higher volumes is not equating into higher prices.

Inflation impacting goods and services especially items like gasoline goes is taking money way that might be attributed to a buyer’s mortgage payment. Overall economic concerns of inflation and employment along with the continued impact of the short sale and bank owned property market are keeping housing prices down.  Another factor to watch as the list to sell ratio. This is the difference between what a home was originally listed for and what the seller eventually accepted as an offer. The number typically is in the 3% area, however looking below the number has grown to 5% and higher on average.

simi valley home sales february 2011 graph

simi valley home sales february 2011 chart


Simi Valley Home Sales Report for January 2011

Simi Valley family detached home sales report for January 2011 really doesn’t jump out compared to last couple of years; pretty much the same activity. Sales under $500,000 continue to dominate the market, with sales under $300,000 continuing to show the market moving along a base price point. The year-over-year average sales price remains in the $460,000 range and the year over year monthly average sales volume has average approximately 80 homes per month for single-family detached units.

The number to watch on the chart for this year will be the “List to Sell Ratio”. This is the price of the house ends up selling at compared to what the property was listed for. If you are a home seller in any one of these ranges you can get a good idea what you expect as a final sales price based on the current activity.  The condition and upgrade of any property can negate lower list to sell ratios, but it is important to see how buyers are reacting and prepare your property accordingly prior to selling.

simi valley home sales January 2011 chart

simi valley home sales january 2011 graph