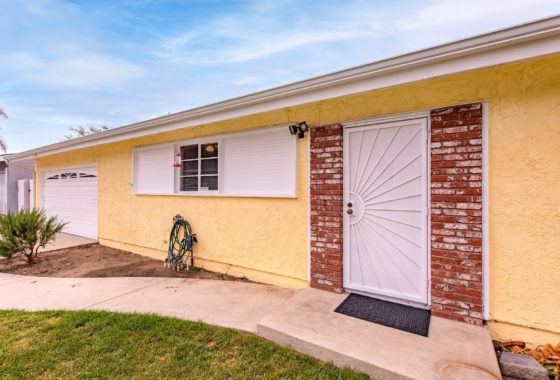
Simi Valley Moorpark Real Estate Market Update Jan-09 YTD
The following report contains the Year To Date housing activity for Simi Valey & Moorpark California. At first glance it is nice to see that what was happening this time last year is not being repeated. Sales for the January in Simi Valley was 35 total single family detached homes. This year we had 73. While this is good news. It still will be some time before we will know where this market will bottom out.
| Activity – Single Family Detached Homes | ||
| Active Listings | Simi Valley | Moorpark |
| Active | ||
| # Units | 400 | 130 |
| Average List Price | 576,505 | 832,652 |
| Average Days Listed | 126 | 104 |
| Pending Sales in Escrow | ||
| # Units | 77 | 23 |
| Average List Price | 403,868 | 552,328 |
| Average Days on Market | 80 | 96 |
| Total Closed Sales for 2008 | ||
| # Units | 73 | 18 |
| Average List Price | 441,094 | 576,775 |
| Average Sold Price | 431,112 | 554,539 |
| Average Days Listed | 84 | 65 |
| Average Closed Sales per month | 73 | 18 |
| Unsold Inventory Index (in months) | 5.478 | 7.22 |
| Activity – Single Family Attached Homes | ||
| Active Listings | Simi Valley | Moorpark |
| Active | ||
| # Units | 117 | 35 |
| Average List Price | 325,655 | 262,325 |
| Average Days Listed | 145 | 133 |
| Pending Sales in Escrow | ||
| # Units | 21 | 12 |
| Average List Price | 282,593 | 274,940 |
| Average Days on Market | 148 | 82 |
| Total Closed Sales for 2008 | ||
| # Units | 11 | 7 |
| Average List Price | 263,317 | 249,229 |
| Average Sold Price | 257,414 | 243,371 |
| Average Days Listed | 80 | 62 |
| Average Closed Sales per month | 11 | 7 |
| Unsold Inventory Index (in months) | 10.64 | 5.00 |

Leave a Reply