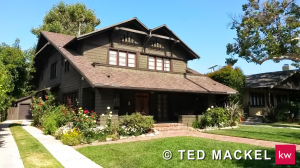
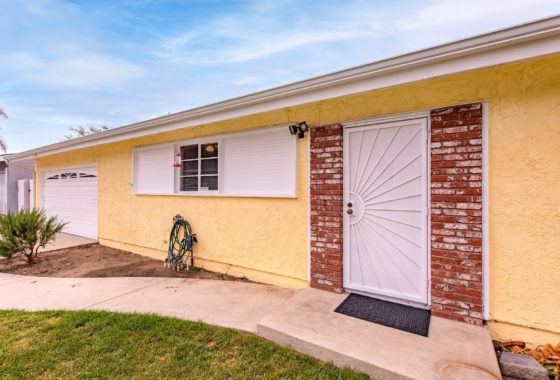
 Sales volumes of Simi Valley homes for July 2014 pulled back with 8% fewer homes sold compared to July 2013. While this may seem like a setback, sales were still strong breaking the 110 unit benchmark for the summer. Homes in the $500,000-$800,000 range saw increases in volumes. Average days on market trended closer to two months and home sellers are seeing 3% to 6% reduction in the list to sell ratio. Median home prices are staying on track at $480,000 per house in Simi Valley. Even though the list sell ratio is taking a little bigger hit, this is more a result from a larger percent of the inventory starting out overpriced. The concern would be if the list to sale ratio and the median home price began to drop simultaneously. This is not happening. This more stable market may not be exciting, but stability is good for housing in California.
2014 Simi Valley Median Home Price by Month
|
January 2014 – $485,000.00 (Very few homes sold below $400,000) |
|
February 2014 – $448,000.00 (Few higher end homed sold, no sales over $900,000) |
|
March 2014 – $475,000.00 |
|
April 2014 – $477,850.00 |
|
May 12014 – $490,000.00 (23 sales over $700,000 with 5 of those over 1 million) |
|
June 2014 – $475,000.00 |
|
July 2014 – $480,000.00 ( 8 sales over $700,000 with 2 over 1 million) |
[wnt_grid maptype=”disabled” exactcity=”1″ ownertype=”all” paginated=”false” sortoptions=”false” maxresults=”50″ search_mode=”form” primarysearchtype=”active” searchtype=”city” state=”CA” min_price=”0″ max_price=”500000″ listing_status=”Active” county=”Ventura” city=”Simi Valley” /]

Leave a Reply