[wnt_grid ownertype=”all” paginated=”false” sortoptions=”false” maxresults=”3″ search_mode=”form” primarysearchtype=”active” searchtype=”city” state=”CA” min_price=”0″ max_price=”1000000000″ listing_status=”Active” county=”Ventura” city=”Simi Valley” single_family=”y” built_after=”2005″ /]
Simi Valley Home Sales volumes for November 2013 continued below pace from the previous year. There were approximately 22% fewer homes sold this November over 2012. List to sell ratios continued their October averages at 3% to 4% below the original list price. The heated run-up and pricing is slowing however certain properties are still selling with multiple offers and competition partly due in part to lower inventory.
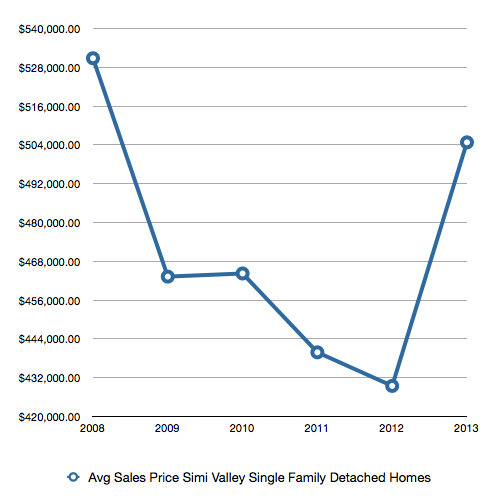
The Simi Valley housing market hit its official bottom in 2012, any slowing or stabilization of the market as we are seeing now is all normal and is no indication of return market conditions of a few years ago. Below is a chart of Simi Valley average sale prices by year which show form the beginning of the marker declines through this month.


Leave a Reply