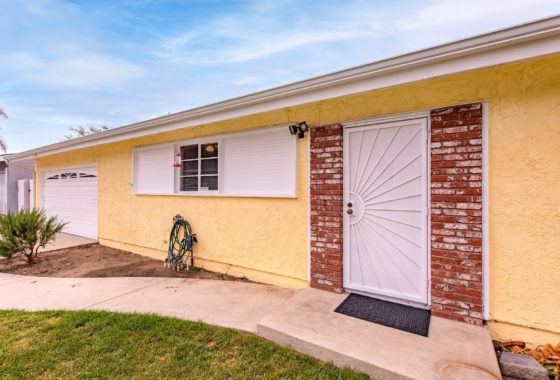
Simi Valley and Moorpark Real Estate Market Data Through May 2008
The following information contains the year to date numbers for the Simi Valley Moorpark Housing Market taken from the Ventrua County Regional Data Share MLS.
The number of homes selling are picking back up. Prices continue to decline and financing is becoming harder to obtain for many buyers. Banks are still struggling to find their way in negotiating Short Sale properties.
Simi Valley & Moorpark
Market report January 1, 2008 through May 31, 2008
| Activity – Single Family Detached Homes | ||
| Active Listings | Simi Valley | Moorpark |
| Active | ||
| # Units | 524 | 192 |
| Average List Price | 618,220 | 855,239 |
| Average Days Listed | 91 | 95 |
| Pending Sales in Escrow | ||
| # Units | 149 | 25 |
| Average List Price | 509,479 | 612,740 |
| Average Days on Market | 71 | 81 |
| Total Closed Sales for 2008 | ||
| # Units | 333 | 67 |
| Average List Price | 569,627 | 680,060 |
| Average Sold Price | 543,436 | 650,517 |
| Average Days Listed | 88 | 108 |
| Average Closed Sales per month | 66.6 | 13.4 |
| Unsold Inventory Index (in months) | 7.87 | 14.32 |
| Activity – Single Family Attached Homes | ||
| Active Listings | Simi Valley | Moorpark |
| Active | ||
| # Units | 176 | 54 |
| Average List Price | 358,871 | 331,296 |
| Average Days Listed | 85 | 79 |
| Pending Sales in Escrow | ||
| # Units | 24 | 3 |
| Average List Price | 310,925 | 364,103 |
| Average Days on Market | 53 | 67 |
| Total Closed Sales for 2008 | ||
| # Units | 57 | 15 |
| Average List Price | 352,781 | 336,240 |
| Average Sold Price | 381,625 | 325,368 |
| Average Days Listed | 88 | 82 |
| Average Closed Sales per month | 11.4 | 3.0 |
| Unsold Inventory Index (in months) | 15.44 | 18.0 |

Leave a Reply