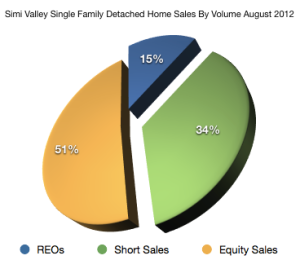
 The Simi Valley Housing Market continues to show mixed signals. If you talk to most buyers and Real Estate Agents, they will tell you how hard it is to find a home. They will tell you about all the homes that are selling with multiple offers and that there are just not enough properties available for sale. Even with this restricted inventory and hot buyer’s market, how come the average home sales price is below list price? Lets dig deep into several of the price ranges and look at what is going on:
Single Family Detached Home Sales for August 2012
- Under $300k – 17 total sales at 93.98% of list price, 6 units sold at or above List Price. All properties sold were distressed. 11 were Short Sales, 6 were Bank Owned. No property were sold by Equity Sellers.
- $300k – $400k – 48 total sales at 98.46% of list price, 10 units sold at or above list price. 16 properties were Short Sales, 6 were Bank Owned (REO) and the rest were Standard Equity Sellers.
- $400k-$500k – 22 total sales at 95.1 of list price, 5 units sold at or above list price. 4 were Short Sales, 1 property was Bank Owned (REO) and the remaining were Equity Sellers.
- $500k – $600k – 10 total sales at 97.9% of list price, 3 units sold at or above list price. 4 were Short Sales, 2 were Bank Owned (REO) and the remaining 4 were Equity Sellers.
- $600k – $700k – 8 total sales at 98.99% of list price, 5 units sold at or above list price. 4 were Short Sales, 4 were Equity Sellers and no Bank Owned Properties were sold in this range.
- $700k – $800k – 6 total sales at 99.17% of list price, 3 units sold at or above list price. 1 was a Short Sale, 2 were Bank Owned (REO) and the remaining three were Equity Sellers.
- $800k – $900k – 2 total sales at 97.5% of list price, zero units sold at or above list price. Standard Equity Sales.
- $900k – $1 million – 2 total sales at 97.45 of list price, zero units sold at or above list price. Standard Equity Sales.
- Over $1 million – 1 total sale at 102.34 of list price, 1 unit sold at or above list price. This was a Bank Owned Property (REO)
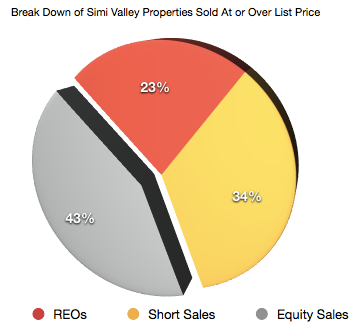
The above chart represents only 44 of the 117 total sales in the month of August. These are the homes that sold for List Price or more. This is a breakdown comparing distressed and non distressed sales receiving full price or over full price offers.
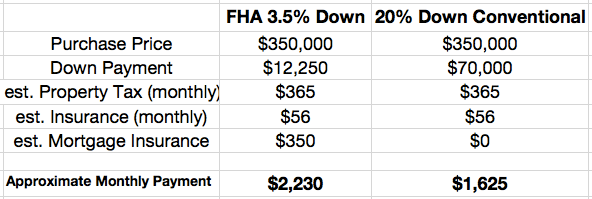
So what are we to make of full price offers or heavy competition for properties in this market? With under 140 homes for sale on any given day in Simi Valley and an average of 115 closings each month the buyers looking for homes do not have much to choose from. Low pricing and favorable interest rates are bringing out buyers putting more pressure on the restricted inventory. Is the bigger motivator the rent vs buy comparison. Looking at a typical 3 bedroom 2 bathroom Simi Valley home, average rents run from $2,000 to $2,400 per month. Right now the above average homes for this rental range are priced over $350,000 and closer to $375,000. Below is a comparison of a low down payment FHA purchase to a 20% down conventional loan.
The payments on these loans are very competitive with rental payments. This calculation was for a $350,000 purchase and there are plenty of homes going out under $350,000 which would make the purchase vs. rent comparison even more attractive. I believe that if the average home price rises above the rent vs buy tolerance threshold, that the increased buying activity we have seen the last several months will cool off. Increasing interest rates terms will negatively affect any market recovery as well as any kind of influx of new inventory. It is exciting to see the confidence in the market by the buyers who are out there now, but several factors will need to be worked through to understand if the confidence is long term or short term.


Leave a Reply