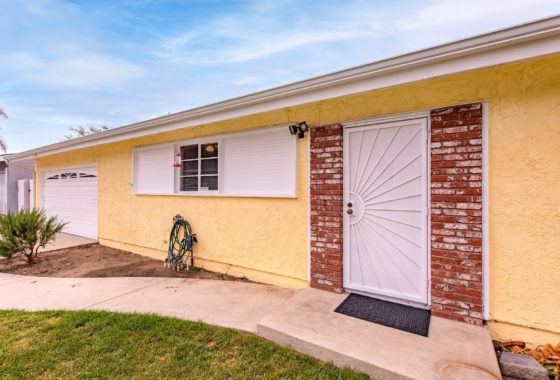
Simi Valley Homes For Sale Market Report May 31st 2009
My Video Commentary on the current Simi Valley Real Estate market conditions will follow shortly. For now the closing numbers up through the end of May are below. Oh Yeah, no we have not hit bottom yet…..I’ll explain later.
| Activity – Single Family Detached Homes | ||
| Active Listings | Simi Valley | Moorpark |
| Active | ||
| # Units | 336 | 107 |
| Average List Price | 596,548 | 1,039,990 |
| Average Days Listed | 122 | 119 |
| Pending Sales in Escrow | ||
| # Units | 133 | 30 |
| Average List Price | 447,936 | 540,551 |
| Average Days on Market | 67 | 94 |
| Total Closed Sales for 2008 | ||
| # Units | 372 | 97 |
| Average List Price | 450,372 | 568,373 |
| Average Sold Price | 440,218 | 543,801 |
| Average Days Listed | 87 | 79 |
| Average Closed Sales per month | 74.4 | 19.4 |
| Unsold Inventory Index (in months) | 4.52 | 5.15 |
| Activity – Single Family Attached Homes | ||
| Active Listings | Simi Valley | Moorpark |
| Active | ||
| # Units | 129 | 29 |
| Average List Price | 307,286 | 265,860 |
| Average Days Listed | 174 | 123 |
| Pending Sales in Escrow | ||
| # Units | 23 | 9 |
| Average List Price | 264,604 | 292,657 |
| Average Days on Market | 81 | 58 |
| Total Closed Sales for 2008 | ||
| # Units | 66 | 38 |
| Average List Price | 271,800 | 260,764 |
| Average Sold Price | 264,504 | 252,390 |
| Average Days Listed | 83 | 97 |
| Average Closed Sales per month | 13.2 | 7.6 |
| Unsold Inventory Index (in months) | 9.77 | 3.18 |

Leave a Reply