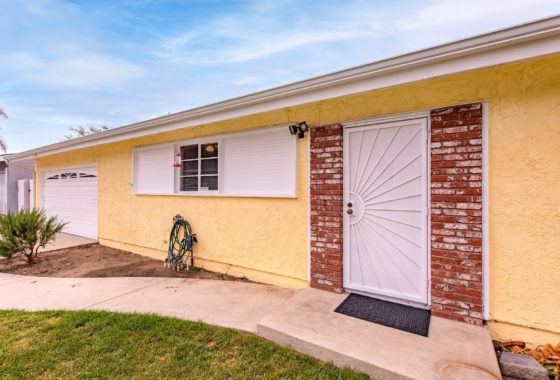
Simi Valley Housing Market Update YTD August 31, 2009
Simi Valley Home Sales through August 31, 2009 continue with similar trending patterns as June, July and August are following our typical seasonal patterns of lower volumes as we head in to the fourth quarter. Simi Valley Single Family detached homes peaked in May at 92 closings and pulled back to 80 a month for June, July and August. This is 18 units fewer than in 2008 for June and July; 7 fewer than August 2008. While low interest rates, historically low inventory and the $8000.00 federal tax credit for first time buyers continues to drive the lower end of the market, the recovery is going to be protracted and drawn out. Any substantial increase in interest rates, available inventory or pricing could put the brakes on an already struggling Simi Valley housing market.
| Activity – Single Family Detached Homes | ||
| Active Listings | Simi Valley | Moorpark |
| Active | ||
| # Units | 347 | 109 |
| Average List Price | 563,665 | 1,007,273 |
| Average Days Listed | 108 | 130 |
| Pending Sales in Escrow | ||
| # Units | 105 | 26 |
| Average List Price | 444,521 | 693,922 |
| Average Days on Market | 61 | 81 |
| Total Closed Sales for 2008 | ||
| # Units | 635 | 171 |
| Average List Price | 465,188 | 566,132 |
| Average Sold Price | 456,256 | 548,764 |
| Average Days Listed | 84 | 84 |
| Average Closed Sales per month | 79.38 | 21.38 |
| Unsold Inventory Index (in months) | 4.37 | 5.10 |
| Activity – Single Family Attached Homes | ||
| Active Listings | Simi Valley | Moorpark |
| Active | ||
| # Units | 142 | 27 |
| Average List Price | 309,242 | 263,843 |
| Average Days Listed | 183 | 125 |
| Pending Sales in Escrow | ||
| # Units | 31 | 13 |
| Average List Price | 277,241 | 284,832 |
| Average Days on Market | 61 | 71 |
| Total Closed Sales for 2008 | ||
| # Units | 122 | 57 |
| Average List Price | 279,051 | 264,168 |
| Average Sold Price | 271,051 | 258,018 |
| Average Days Listed | 97 | 87 |
| Average Closed Sales per month | 15.25 | 7.13 |
| Unsold Inventory Index (in months) | 9.31 | 3.79 |

Leave a Reply