Simi Valley Housing Market Update YTD September 30, 2009
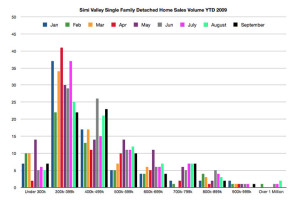
Simi Valley Home Sales are following the typical pattern we’ve seen over the last several months. Home sales are still below prior year levels and the impact of the first-time home buyer tax credit, historically low inventory, historically low interest rates continue to drive the entry-level end of housing. I posted a colorful chart which shows the bulk of the sales still are under 500,000. What has been surprising is, as I went back over June, July and August there were additional closings that wee reported late which move those numbers up. We’re still averaging about 80 sales a month for 2009 but with the new information the summer months were more stable than indicated prior to the late reporting.
If you are a Simi Valley home buyer the market still poses obstacles for those looking to purchase homes under $500,000. We are seeing competition for these homes in the form of large down payments and multiple buyers.
In reviewing the Simi Valley home sales from January 2009 through September 2009, approximately 65% of all homes sold in Simi Valley were purchased with conventional financing, another 10% with all cash offers. This leaves approximately 25% of the sales using VA or FHA low down payment financing. What this means for future home buyers is that your competition will not only be the low inventory, it will be other buyers with higher down payments. While an FHA or VA loan can bring the same offer price to a seller, sellers tend to feel more comfortable with higher down payment conventional loans than their FHA or VA counterparts. Also sellers who have homes with any deferred maintenance could obstacles for FHA or VA financing over those maintenance items.
If you are a home seller to low inventory, low interest rates and the tax credit has definitely created interested buyers. If your home is below $500,000 to low inventory is created fewer competing homes for potential buyers to view. What is interesting about this market is that if your home is over $500,000 low inventory becomes less and less a factor as the price of your home movies up. In fact earlier charts have posted show inventory surpluses in the homes that are in the 700,000 $1 million range.
Part of my day involves completing Broker Price Opinions for several area banks. A “BPO” is requested by banks trying to value distressed properties on their asset sheets. My task for the bank is to evaluate the property they have given me by locating closings and listings in the area that will give the bank an idea of the value of the subject property. I’m completing BPO’s for Simi Valley, Moorpark, Thousand Oaks, Westlake, Agoura, Hidden Hills, Calabasas, Woodland Hills, West Hills, Chatsworth, Tarzana, Canoga Park, Winnetka, Northridge, Porter Ranch, Reseda and Encino. I have completed close to 200 in the last 12 months.
This look into the values of properties and surrounding areas shows interesting trends in the general market from entry level to high end. The trends I have been reporting on in Simi Valley are seen in these other areas.
A number of issues remain unresolved for the market from here going out, there is discussion in Washington DC to extend the first-time buyer’s tax credit and also open the tax credit to existing homeowners however this has not been voted on or finalized by the House or Senate. Any hikes in interest rates over 6% or higher will impact buyer payments as well. There are still record amount of loans in trouble, foreclosed properties and the unemployment levels will have lingering effects on the market over the next couple of years.
There are big advantages in purchasing a home in this market if the purchase is not an impulse buy. Affordability is at the highest levels in a very long time combined with low interest rates, Simi Valley home buyers have a great opportunity to make a smart buy.
| Activity – Single Family Detached Homes | ||
| Active Listings | Simi Valley | Moorpark |
| Active | ||
| # Units | 337 | 111 |
| Average List Price | 558,761 | 1,082,370 |
| Average Days Listed | 107 | 131 |
| Pending Sales in Escrow | ||
| # Units | 119 | 18 |
| Average List Price | 456.011 | 704,586 |
| Average Days on Market | 65 | 74 |
| Total Closed Sales for 2008 | ||
| # Units | 716 | 191 |
| Average List Price | 467,300 | 578,603 |
| Average Sold Price | 458,397 | 562,665 |
| Average Days Listed | 83 | 84 |
| Average Closed Sales per month | 79.55 | 21.22 |
| Unsold Inventory Index (in months) | 4.24 | 5.23 |
| Activity – Single Family Attached Homes | ||
| Active Listings | Simi Valley | Moorpark |
| Active | ||
| # Units | 134 | 23 |
| Average List Price | 302,738 | 266,163 |
| Average Days Listed | 192 | 105 |
| Pending Sales in Escrow | ||
| # Units | 31 | 17 |
| Average List Price | 276,791 | 265,419 |
| Average Days on Market | 74 | 72 |
| Total Closed Sales for 2008 | ||
| # Units | 151 | 62 |
| Average List Price | 282,911 | 267,314 |
| Average Sold Price | 275,922 | 261,742 |
| Average Days Listed | 94 | 86 |
| Average Closed Sales per month | 15.25 | 7.13 |
| Unsold Inventory Index (in months) | 8.79 | 3.23 |
 |
Thanks for reading Simi Valley’s Premiere Real Estate Blog!
Author – Ted Mackel Simi Valley Real Estate Agent – Keller Williams Realty
Ted Mackel is a top producer at Keller Williams Realty Simi Valley,
specializing in Simi Valley Real Estate
(805) 432-7705

[…] While the averages from the multiple listing service are interesting, if you’ve seen the charting I have posted over the last year, those averages are skewed as the lower end of the market is behaving much […]