 The April 2015 Simi Valley Housing Update shows median home prices in Simi Valley remaining FLAT at $500,000. While there is certainly increased activity, and more properties being listed, buyers refuse to run up the market. In 2005-2006 when the market caught fire and prices flew upward as there was financing available that allowed buyers to ignore income requirements to sustain those loans after they purchased the properties. This time around income will need to support any further significant jumps in pricing. The Federal Reserve Bank at some point will need to raise rates, but remains hesitant for a very long time now. Hikes in rates will limit buying power of future buyers. The threat of rising rate may help sustain higher volumes, but as expected, large gains in home pricing will not show. Single digit appreciation for 2015 is expected with an approximate 3% gain showing for the first 4 months of 2015.
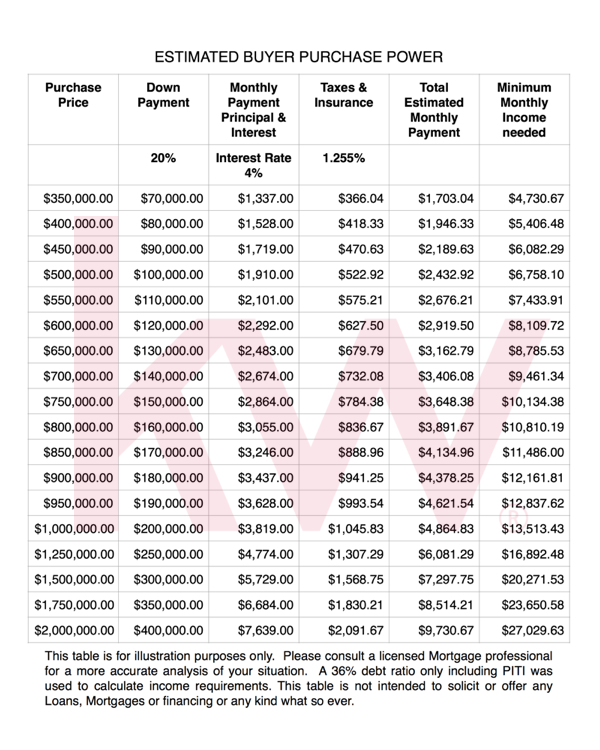
If you are planning to sell your home in the Simi Valley, Moorpark, Conejo Valley or San Fernando Valley areas; the chart below can help you understand what a buyer may need to qualify to buy your home at the price you ask. Please note that any increases in interest rate will cause monthly payments to increase and reduce the amount a buyer can pay for your home. We all want the most amount of money in the shortest amount of time when selling our homes; because the government has kept rates low, home sellers considering putting their home on the market should do so while interest rates are low and affordability is good. Please pick up the phone a call me today for a free market analysis of your home’s value. (805) 432-7705 – cell/text


Hi Ted,
Do you have an exact figure, or even an estimate, as to what percentage of buyers purchase with a 20% (or higher) downpayment in Simi Valley?
That is really a price range answer. More buyers in the lower price ranges are still financing with with FHA 5% down. Not much 20% Down Money in the lower Price ranges.
Thanks. I thought that might be the case. It would look like that shifts the “required income” on your chart one row, which means another 15% in income. It’s hard for me to imagine how people can really afford a $500k house (easily $3,000/month in mortgage+tax+PMI) on $7,400/month ($90k/year). After payroll taxes, that only leaves about $2,000/month for all other expenses.
I still don’t even understand how entry level buyers are even able to come up with a 5% downpayment on a $500,000 house ($25k).
BTW, is there any way to get e-mail notifications when you make new blog posts OR when somebody replies to my comments?