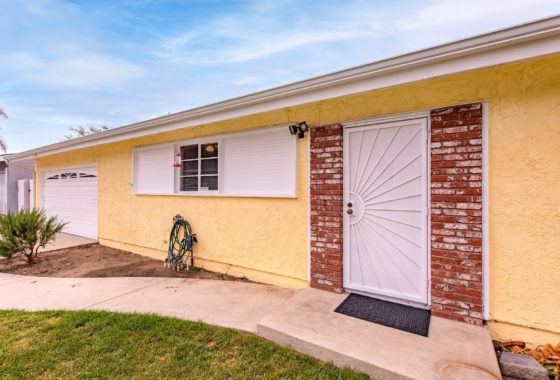
Simi Valley Moorpark Real Estate Market October 2008 Report – YTD Home Sales
The following table contains the numbers for the Simi Valley Moorpark Real Estate housing market from January 1, 2008 through October 31, 2008. Trending shows that the total number of homes for sale has decreased significantly since the beginning of the year. Typically a tightening inventory creates advantages to the seller rather than the buyer and this has not been the case. Tightened credit markets and trouble in the banking industry has made financing tougher. While the number of homes sold on a monthly basis has been steady now since May, the bulk of that inventory has been in the lower end of pricing.
| Activity – Single Family Detached Homes | ||
| Active Listings | Simi Valley | Moorpark |
| Active | ||
| # Units | 447 | 138 |
| Average List Price | 577,632 | 886,337 |
| Average Days Listed | 93 | 91 |
| Pending Sales in Escrow | ||
| # Units | 93 | 17 |
| Average List Price | 447,376 | 549,883 |
| Average Days on Market | 70 | 57 |
| Total Closed Sales for 2008 | ||
| # Units | 820 | 193 |
| Average List Price | 532,683 | 603,738 |
| Average Sold Price | 513,927 | 583,175 |
| Average Days Listed | 84 | 99 |
| Average Closed Sales per month | 82.0 | 19.3 |
| Unsold Inventory Index (in months) | 5.45 | 7.15 |
| Activity – Single Family Attached Homes | ||
| Active Listings | Simi Valley | Moorpark |
| Active | ||
| # Units | 115 | 44 |
| Average List Price | 338,400 | 367,164 |
| Average Days Listed | 118 | 74 |
| Pending Sales in Escrow | ||
| # Units | 33 | 67 |
| Average List Price | 286,816 | 303,114 |
| Average Days on Market | 69 | 55 |
| Total Closed Sales for 2008 | ||
| # Units | 153 | 48 |
| Average List Price | 319,898 | 311,969 |
| Average Sold Price | 308,732 | 301,525 |
| Average Days Listed | 80 | 94 |
| Average Closed Sales per month | 15.3 | 4.8 |
| Unsold Inventory Index (in months) | 7.52 | 9.17 |

[…] October YTD Simi Valley Moorpark Home Sales Report […]