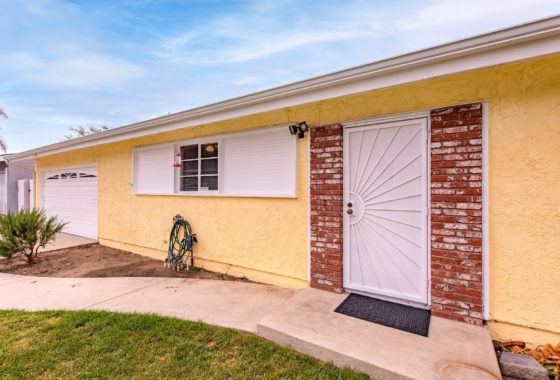
Simi Valley Moorpark Real Estate Market Report YTD June 30, 2008
The following information is the Year To Date numbers for Simi Valley Moorpark Real Estate Homes taken from the Ventrua County Regoinal Data Share MLS. For reporting opn other months, check the Market Updates tab in the catagories section on the right hand side of the main blog page.
| Activity – Single Family Detached Homes | ||
| Active Listings | Simi Valley | Moorpark |
| # Units | 548 | 194 |
| Average List Price | 600,317 | 873,850 |
| Average Days Listed | 92 | 96 |
| Pending Sales in Escrow | ||
| # Units | 121 | 21 |
| Average List Price | 485,717 | 555,461 |
| Average Days on Market | 73 | 118 |
| Closed Sales | ||
| # Units | 439 | 94 |
| Average List Price | 561,352 | 650,424 |
| Average Sold Price | 538,160 | 625,263 |
| Average Days Listed | 89 | 101 |
| Average Closed Sales per month | 73.0 | 15.51 |
| Unsold Inventory Index (in months) | 7.51 | 12.52 |
| Activity – Single Family Attached Homes | ||
| Active Listings | Simi Valley | Moorpark |
| # Units | 152 | 33 |
| Average List Price | 361,800 | 313,035 |
| Average Days Listed | 100 | 103 |
| Pending Sales in Escrow | ||
| # Units | 31 | 14 |
| Average List Price | 309,155 | 304,747 |
| Average Days on Market | 79 | 93 |
| Closed Sales | ||
| # Units | 74 | 22 |
| Average List Price | 350,751 | 337,591 |
| Average Sold Price | 337,548 | 326,378 |
| Average Days Listed | 87 | 81 |
| Average Closed Sales per month | 12.33 | 3.66 |
| Unsold Inventory Index (in months) | 12.32 | 9.0 |

[…] June YTD Simi Valley Moorpark Home Sales Report […]