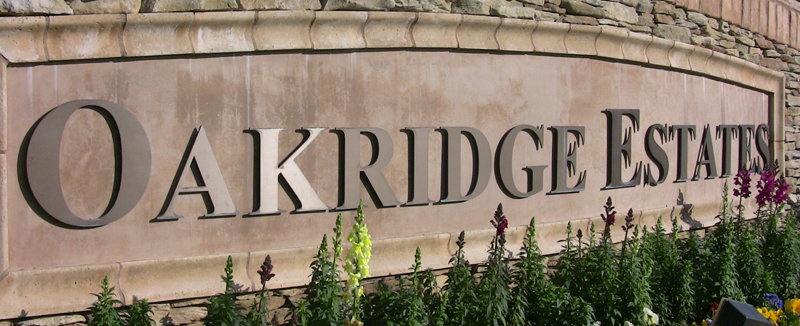
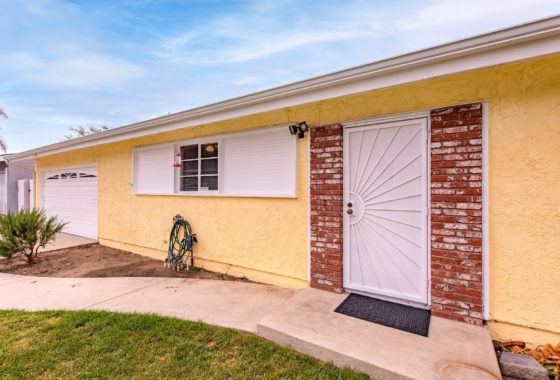
Below are the general home sales trends for homes in Simi Valley Oakridge Estates going back to 2003 to the end of 2009. There are a few homes for sale in the tract currently and as of the end of March 2010, no sales. The data was pulled from the Ventura County Regional Data Share. Because of many changes in the systems that maintain the MLS data in 2003, data is not available from the MLS prior to 2003. There will be an additional blog post with floor plans for the track and I will have graphs illustrating the sales for each particular model.
In looking at the years below, the sales have pretty much returned to pricing close to what we saw in 2003. However what is encouraging is that the Valley View model, the largest model in the tract, is trending better than in 2003.
The tract consists of approximately 220 homes and historically has low turnover. The low turnover is slightly problematic in that it gives appraisal firms fewer comparables to help support price increases. It was interesting as the market was moving up in the 2003 – 2006 markets that Simi Valley Oakridge Estates lagged in the increases compared other tracts.
| Oakridge Estates Simi Valley 2003 Sales Data | |
| AVERAGE Sale Price | 577300 |
| HIGH Sale Price | 615000 |
| LOW Sale Price | 497500 |
| List to Sale Ratio | 100% |
| Average Days on Market | 9 |
| Number of Homes Sold | 5 |
| Oakridge Estate Simi Valley 2004 Sales Data | |
| AVERAGE Sale Price | 710707 |
| HIGH Sale Price | 790000 |
| LOW Sale Price | 598000 |
| List to Sale Ratio | 99% |
| Average Days on Market | 42 |
| Number of Homes Sold | 7 |
| Oakridge Estate Simi Valley 2005 Sales Data | |
| AVERAGE Sale Price | 780855 |
| HIGH Sale Price | 849000 |
| LOW Sale Price | 723000 |
| List to Sale Ratio | 97% |
| Average Days on Market | 100% |
| Number of Homes Sold | 3 |
| Oakridge Estate Simi Valley 2006 Sales Data | |
| AVERAGE Sale Price | 809636 |
| HIGH Sale Price | 979000 |
| LOW Sale Price | 675000 |
| List to Sale Ratio | 96% |
| Average Days on Market | 49 |
| Number of Homes Sold | 6 |
| Oakridge Estate Simi Valley 2007 Sales Data | |
| AVERAGE Sale Price | 786779 |
| HIGH Sale Price | 819000 |
| LOW Sale Price | 738450 |
| List to Sale Ratio | 95% |
| Average Days on Market | 64 |
| Number of Homes Sold | 7 |
| Oakridge Estate Simi Valley 2008 Sales Data | |
| AVERAGE Sale Price | 647833 |
| HIGH Sale Price | 710000 |
| LOW Sale Price | 637000 |
| List to Sale Ratio | 90% |
| Average Days on Market | 69 |
| Number of Homes Sold | 6 |
| Oakridge Estate Simi Valley 2009 Sales Data | |
| AVERAGE Sale Price | 588333 |
| HIGH Sale Price | 765000 |
| LOW Sale Price | 480000 |
| List to Sale Ratio | 94% |
| Average Days on Market | 141 |
| Number of Homes Sold | 5 |
 |
Thanks for reading Simi Valley’s Premiere Real Estate Blog!
Author – Ted Mackel Simi Valley Real Estate Agent – Keller Williams Realty
Ted Mackel is a top producer at Keller Williams Realty Simi Valley,
specializing in Simi Valley Real Estate
(805) 432-7705


[…] This post was mentioned on Twitter by Ted Mackel. Ted Mackel said: Simi Valley Oakridge Estates homes sold market report 2003 – 2009 historical trends http://bit.ly/bQtHfz […]