Simi Valley Real Estate Market Update Year Ending 12-31-08
Happy New Year!!! I wish I could tell you everything is going to get better quick, but really looking at the bigger picture, the whole country especially California will be in for interesting times. If you watched any of the news over the budget battles in Sacramento before the Holidays, the attempts of the state legislature to impose new taxes disguised at fees to avoid the required 2/3rds majority vote is one of the many indicators that the economy has a long way to go. Additionally the bail out money our national congress approved in the fall is going to waste. Close to 6 billion was used to buy a bank in China, some of the College football Bowl sponsoring banks were recipients of the bail out money, the bank execs are still living the high life and there seems to be no accountability required when our elected officials give out money.
While all this may sound like doom and gloom…it really is not. I just want you to temper what you hear about real estate and know that this is the time to buy, BUT and this is a big “but” there is no run up in real estate prices, so you can still make smart purchases. This is a time for a long term buy and hold strategy. I post the closing data YTD for each month here on my blog and you can find that under the market updates categories on the right hand side of the page.
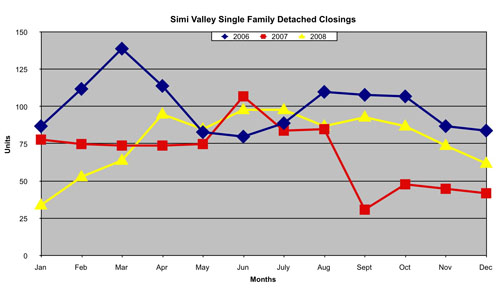
Make sure to read past the year end table as there will be a few charts for Simi Valley Real Estate Trends that I think you will find interesting.
| Activity – Single Family Detached Homes | ||
| Active Listings | Simi Valley | Moorpark |
| Active | ||
| # Units | 392 | 125 |
| Average List Price | 560,821 | 879,395 |
| Average Days Listed | 129 | 110 |
| Pending Sales in Escrow | ||
| # Units | 79 | 20 |
| Average List Price | 417,280 | 491,615 |
| Average Days on Market | 82 | 74 |
| Total Closed Sales for 2008 | ||
| # Units | 972 | 227 |
| Average List Price | 522,247 | 611,736 |
| Average Sold Price | 504,897 | 585,287 |
| Average Days Listed | 91 | 105 |
| Average Closed Sales per month | 81.0 | 18.92 |
| Unsold Inventory Index (in months) | 4.84 | 6.61 |
| Activity – Single Family Attached Homes | ||
| Active Listings | Simi Valley | Moorpark |
| Active | ||
| # Units | 107 | 44 |
| Average List Price | 327,641 | 349,628 |
| Average Days Listed | 136 | 110 |
| Pending Sales in Escrow | ||
| # Units | 25 | 6 |
| Average List Price | 268,374 | 249,117 |
| Average Days on Market | 103 | 61 |
| Total Closed Sales for 2008 | ||
| # Units | 173 | 58 |
| Average List Price | 316,392 | 313,577 |
| Average Sold Price | 306,003 | 303,502 |
| Average Days Listed | 85 | 94 |
| Average Closed Sales per month | 15.72 | 5.09 |
| Unsold Inventory Index (in months) | 7.12 | 8.84 |


Leave a Reply