Properties for sale in the Texas Tract
- Texas Tract Alpines
- Texas Tract Bellwoods
Simi Valley’s Texas tract is one of the more popular areas north of the 118 freeway for home-buyers moving or relocating to Simi Valley. Typically comprised of older homes on larger lots with wide sweeping streets on a gentle sloping downhill, pricing has always been attractive to the largest segment of the market.
Texas tract single-family detached homes is made up of four different subdivisions. The Bellwoods, the Alpine’s, the Parklanes, and the New Monterey’s. The Belwoods and the Alpine’s were the first to tract built nearly 1960s. The shopping center located at the corner of Alamo and Tapo streets was anchored by a supermarket (and if I remember correctly was an Alpha Beta at the time) that center is named The Belwood Center which now houses Fresh and Easy Markets and Yankee Doodles.
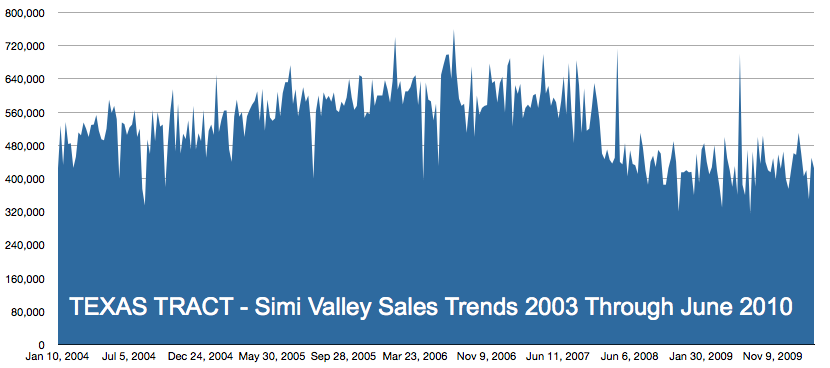
Below are some charts and tables of the sales data for Simi Valley’s Texas Tract beginning January 1, 2004 up through June 28, 2010. The average sales price in the area has dipped significantly below the 2004 averages and looks to be settling in the low $400,000 range. You may also notice that the volume has significantly slowed as well. The high number of foreclosed properties and short sales has added a negative impact on sales in the area.
While homeowners in the tract are patiently waiting for the recovery, those homebuyers looking to relocate into Simi Valley have an opportunity to find good value in one of Simi Valley’s most coveted tracts on the north east end of Simi Valley.
Sales broken down by year with highs, lows averages and days on Market.
| Texas Tract Simi Valley 2004 Sales Data | |
| AVERAGE Sale Price |
$504,993 |
| HIGH Sale Price |
$615,000 |
| LOW Sale Price |
$335,000 |
| List to Sale Ratio | 97.76% |
| Average Days on Market (DOM) | 14 |
| Number of Homes Sold | 59 |
| Texas Tract Simi Valley 2005 Sales Data | |
| AVERAGE Sale Price |
$572,713 |
| HIGH Sale Price |
$673,000 |
| LOW Sale Price |
$399,000 |
| List to Sale Ratio | 97.60% |
| Average Days on Market (DOM) | 14 |
| Number of Homes Sold | 69 |
| Texas Tract Simi Valley 2006 Sales Data | |
| AVERAGE Sale Price |
$608,810 |
| HIGH Sale Price |
$760,000 |
| LOW Sale Price |
$395,000 |
| List to Sale Ratio | 97.10% |
| Average Days on Market (DOM) | 45 |
| Number of Homes Sold | 52 |
| Texas Tract Simi Valley 2007 Sales Data | |
| AVERAGE Sale Price |
$588,545 |
| HIGH Sale Price |
$700,000 |
| LOW Sale Price |
$485,000 |
| List to Sale Ratio | 94.65% |
| Average Days on Market (DOM) | 81 |
| Number of Homes Sold | 33 |
| Texas Tract Simi Valley 2008 Sales Data | |
| AVERAGE Sale Price |
$443,736 |
| HIGH Sale Price |
$712,500 |
| LOW Sale Price |
$320,000 |
| List to Sale Ratio | 87.71% |
| Average Days on Market (DOM) | 89 |
| Number of Homes Sold | 35 |
| Texas Tract Simi Valley 2009 Sales Data | |
| AVERAGE Sale Price |
$432,076 |
| HIGH Sale Price |
$700,000 |
| LOW Sale Price |
$315,000 |
| List to Sale Ratio | 97.07% |
| Average Days on Market (DOM) | 67 |
| Number of Homes Sold | 37 |
| Texas Tract Simi Valley 2010 Sales Data | |
| AVERAGE Sale Price |
$427,617 |
| HIGH Sale Price |
$510,000 |
| LOW Sale Price |
$350,000 |
| List to Sale Ratio | 95.05% |
| Average Days on Market (DOM) | 47 |
| Number of Homes Sold | 12 |


[…] This post was mentioned on Twitter by Ted Mackel, Simi Valley Dude. Simi Valley Dude said: Texas Tract Simi Valley Sales Trends from 2004 through June 2010: Simi Valley's Texas tract is one of the more pop… http://bit.ly/d4rOvT […]